
Five Point Three Trillion
The NHE data is out. What it reveals about utilization, intensity, and the infrastructure gap in American healthcare.

An Invitation
I’ve built an interactive tool to explore this NHE data in more detail. You can find it at AmericanHealthCosts.com. It allows you to drill into spending by category, payer, and year in ways that the static Health Affairs tables do not support.
The data does not speak for itself. But it does reward careful attention.
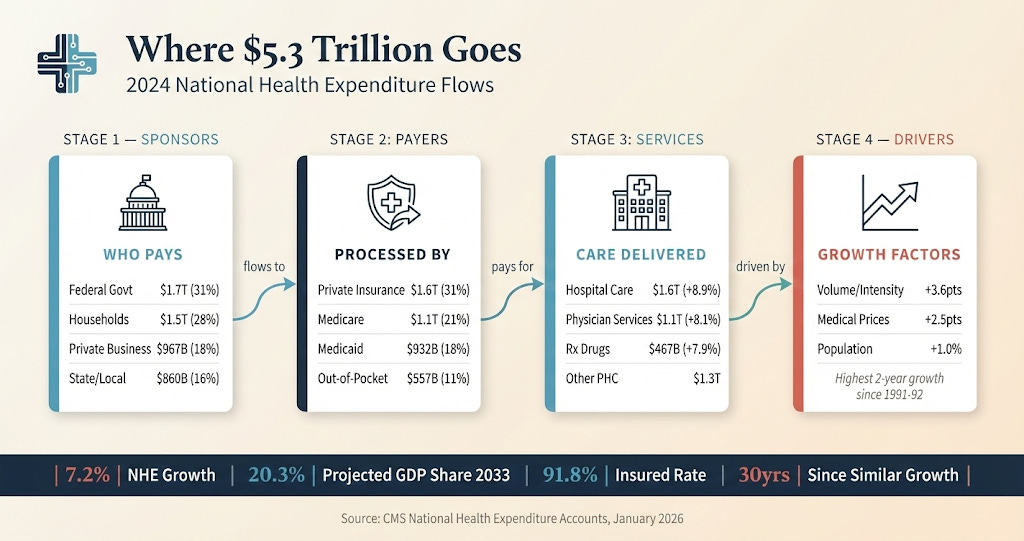
CMS released the 2024 National Health Expenditure data this week. The headline figure, $5.3 trillion, has the virtue of being both enormous and meaningless. Fifteen thousand four hundred seventy-four dollars per person. Seven point two percent growth. Eighteen percent of GDP. The numbers are so large it feels they cease to be informative. Michael Chernew has a nice editorial on the topic and interviewed on the Health Affairs podcast this last week.
What is more easy to digest, and what certainly matters is the trend. And the trend is concerning for reasons that have nothing to do with what most commentators are discussing.
The conventional narrative around healthcare costs centers on price. High drug prices. Hospital consolidation driving up rates. Insurer profits. These are real issues. But they are not what drove 2024 spending growth.
Medical inflation was essentially flat. Retail drug prices, net of rebates, rose at a rate below general inflation. Private insurer nonmedical spending grew at 4.4 percent, well below overall spending growth. The insurers themselves were caught off guard by medical losses that exceeded projections.
This was a utilization story.
The Numbers
Personal health care spending averaged 8.9 percent annual growth in 2023 and 2024. This is the highest rate for two consecutive years since 1991 and 1992. We have not seen anything like this in thirty years.
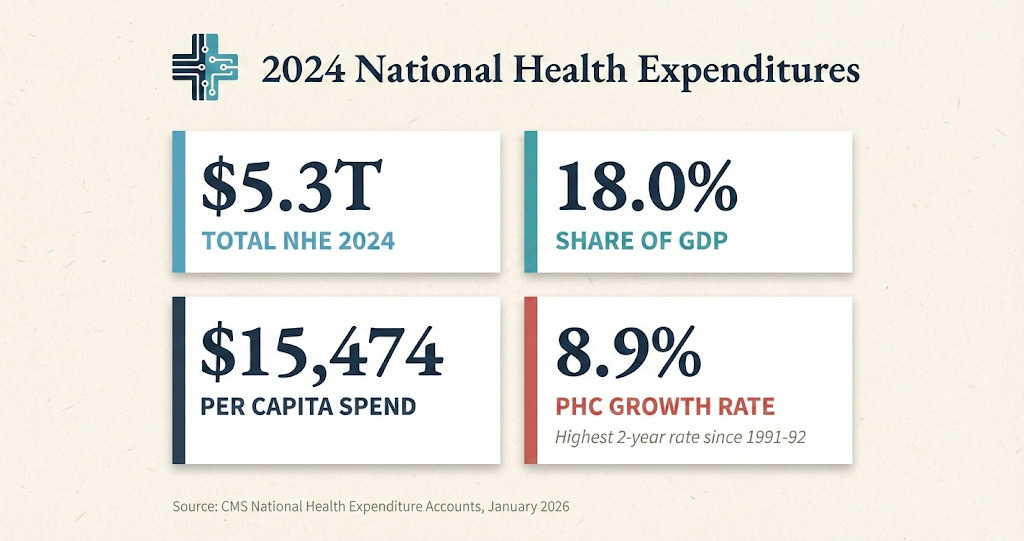
Hospital care grew 8.9 percent to $1.6 trillion. Physician and clinical services grew 8.1 percent to $1.1 trillion. Retail prescription drugs grew 7.9 percent to $467 billion. The growth was broad-based. It was not isolated to any single payer or sector.
The insured share of the population held relatively steady at 91.8 percent, down slightly from the all-time peak of 92.5 percent in 2023. Marketplace enrollment surged to 21.1 million. Medicaid shed 7.9 million enrollees as the continuous enrollment provision expired. The coverage picture is stable. The spending picture is not.
When you strip out population growth and medical price increases, what remains is volume and intensity. More encounters. Higher-acuity service mix. Shifts from lower-cost settings to higher-cost settings. This residual factor accounted for 3.6 percentage points of the 6.1 percent per capita increase in 2024.
For context, the average during 2014-2019 was 2.7 percent. We are running nearly a full percentage point faster than the pre-pandemic baseline, and we are running faster than GDP growth by a meaningful margin.
What’s Driving the Spend
There are several mechanisms worth understanding.
The first is pent-up demand. People delayed care during the pandemic. Some of that demand has been released. Hospital days increased 1.5 percent and discharges increased 3.2 percent in 2024. This is not a permanent phenomenon, but its duration remains unclear.
The second is coding intensity. Payment for services depends on service codes, and coding patterns are shifting. There is evidence of increased sepsis coding, more frequent use of higher-acuity evaluation and management codes, and adoption of new E&M codes that capture complexity more granularly.
The role of artificial intelligence in this shift is uncomfortable to discuss. Ambient scribes and AI-assisted documentation tools are accelerating adoption of coding practices that maximize reimbursement. Whether this represents more accurate capture of clinical complexity or systematic upcoding is an empirical question we have not yet answered. Both dynamics are probably at play.
The third is expensive products. GLP-1 agonists for diabetes and obesity are the obvious example. Despite declining prices, utilization growth drove spending increases. But other categories matter too. Skin substitutes, used in wound care, have seen utilization and prices climb. Part B physician-administered drugs, including skin substitutes, contributed materially to Medicare fee-for-service spending growth in 2024.
The fourth, and least discussed, is infrastructure evolution. The healthcare delivery landscape is constantly reconfiguring. New ambulatory surgical centers. Physician practice acquisition by health systems. Private equity entry into various specialties. Shifts in patient flow from community hospitals to academic medical centers, or from office settings to hospital outpatient departments. Each of these shifts can increase spending even when prices within settings remain stable.
None of these drivers respond to the interventions most commonly proposed in policy debates. Price controls do not solve a utilization problem. Insurer margin compression does not address coding intensity. The mismatch between diagnosis and prescription is substantial.

The AI Paradox
I spend my professional life building AI systems for care coordination. So I should be clear about what I see happening.
AI in healthcare is developing along two distinct tracks. The first track is administrative optimization. Coding assistance. Prior authorization automation. Revenue cycle management. This track generates returns primarily by capturing more reimbursement from payers. It does not reduce system-wide spending. It redistributes it.
The second track is clinical efficiency. Care navigation. Chronic disease management. Post-surgical monitoring. Early intervention based on risk stratification. This track has the potential to reduce aggregate spending by avoiding complications, preventing hospital readmissions, and identifying problems before they become expensive.
The current adoption pattern favors the first track. This is not because healthcare leaders are short-sighted. It is because the first track has a straightforward business case. You deploy the tool, you increase revenue, you measure the return. The second track requires risk-bearing arrangements, population health infrastructure, and outcome measurement systems that many organizations lack.
The result is that AI may be contributing to spending growth in the near term while theoretically offering savings in the long term. Whether we capture those long-term savings depends on how we structure payment. If we continue paying fee-for-service, AI will optimize fee-for-service. If we shift to models that reward outcomes, AI will optimize outcomes.
RevelAi exists because we believe the second track is where value will ultimately flow. But I would be lying if I said the market has fully arrived at that conclusion.
“If we continue paying fee-for-service, AI will optimize fee-for-service. If we shift to models that reward outcomes, AI will optimize outcomes.”

What We Should Be Talking About
The policy response to unsustainable spending growth typically falls into three categories.
The first is cost-shifting. Reducing the federal share of Medicaid. Increasing out-of-pocket costs for beneficiaries. Reducing employer contributions. This approach does not solve the underlying problem. It simply changes who bears the burden. And when cost-shifting reduces access to high-value care, it can actually increase total spending over time.
The second is price regulation. Medicare fee schedule reform. Reference pricing. Drug price negotiation. These tools have their place, but they do not address utilization growth. And aggressive price controls without productivity improvements can create access problems.
The third, and most promising, is delivery system reform. Alternative payment models that create incentives for efficient practice. Utilization management programs that distinguish low-value from high-value care. Infrastructure investments in care coordination and population health management.
The challenge is that delivery system reform is hard. It requires organizational change, technology deployment, workflow redesign, and risk tolerance. It requires health systems to invest in capabilities that do not generate fee-for-service revenue. It requires payers to share savings in ways that justify provider investment.
CMS has been active in this space. The ACCESS Model. The GUIDE Model. The TEAM Model. Various bundled payment expansions. The Inflation Reduction Act provisions that shift financial responsibility within Medicare Part D. These are serious attempts to create incentive structures that reward efficiency.
Whether they will work depends on adoption. And adoption depends on making participation economically rational for the organizations we need to transform care delivery.
The Strategic Calculus
For Health Systems
The message in this data is that utilization growth is not your friend in the medium term. Yes, higher volumes generate higher revenue under fee-for-service. But payer responses are coming. Medicare Advantage benchmark adjustments in 2024 already demonstrated that CMS will adjust payment rates when utilization exceeds projections. Private insurers reported unanticipated medical losses. Neither group will accept persistent outperformance against actuarial assumptions. The rational response is to invest now in capabilities that will position you for a value-based future. Care navigation infrastructure. Population health analytics. Post-acute care coordination. Outcome measurement systems.
For Digital Health Companies
Tools that reduce total cost of care have a more durable value proposition than tools that optimize revenue cycle. The revenue cycle optimization market is crowded, margin-compressed, and ultimately zero-sum at the system level. The care efficiency market is early, differentiated, and aligned with where policy is heading.
For Clinicians
Coding intensity gains will not persist indefinitely. When they attract regulatory scrutiny, the adjustments will be sudden and painful. Building a practice on sustainable clinical value is a better long-term strategy than building one on coding optimization. I remain convinced we all need to learn to be better at upstream prevention and longitudinal care management for our patients.
The Question That Lingers
Eighteen percent of GDP devoted to healthcare. Twenty point three percent projected by 2033. At some point, this trend line becomes incompatible with the other things a society wants to fund. Education. Infrastructure. Defense. Climate adaptation. Social insurance.
We have been saying this for decades. And yet spending growth continues to outpace economic growth. The question is whether we are approaching an inflection point where the political will to address underlying drivers finally materializes, or whether we will continue treating symptoms while the disease progresses.
The infrastructure for a different approach exists. The payment models are being designed. The technology is available. What remains uncertain is whether we will use them, and time will ell if we are willing to put frameworks in place to do so wisely.
Christian Pean, MD, MS is CEO and Co-Founder of RevelAi Health, Executive Director of AI & IT Innovation at Duke Health, and Assistant Professor of Orthopaedic Surgery at Duke University. He writes the Techy Surgeon newsletter on clinical AI and health policy for surgeons and health system leaders.